Another Form of Appreciation
By Alexander Fenlon
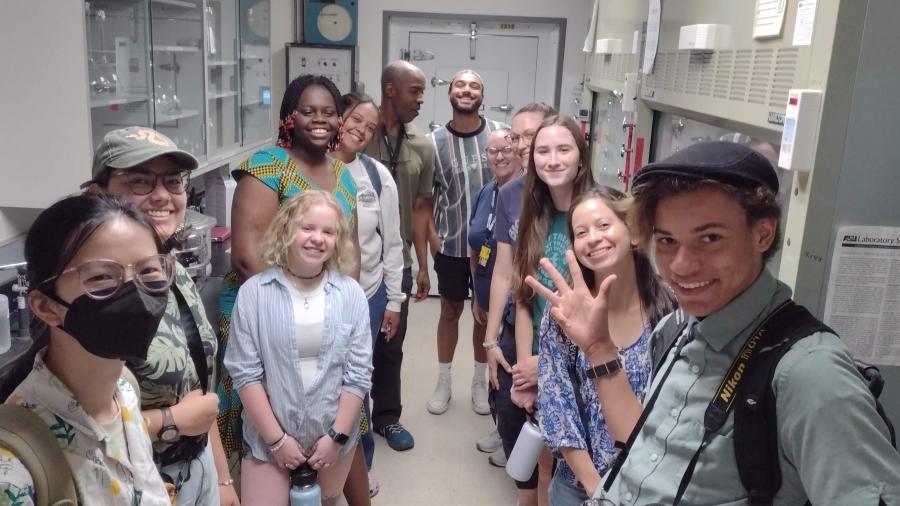
During the first week of our program, we visited a lab associated with the Central Arizona–Phoenix Long-Term Ecological Research as part of our campus tour. Gawking at a worktable covered in dusty plant samples, taking puzzled glances at pouches filled with nothing but atmospheric gases, and snaking past each other as we crammed into a room-sized freezer, we were privy to myriad facets of our local ecosystem in perfect isolation: crystal-clear data.
We were waving our goodbyes when a pleading cry was issued from the end of the corridor. Quincy Stewart, one of the project’s managers, called out, “Don’t forget the CAP LTER website! There’s reams of data there and you could be the one to do something with it.” As we headed to the next lab, I wondered if he was exhorting me to some cause.
It wasn’t until 4 weeks later, when Andrew Johnston and Kelsey Yule walked into our lab classroom, hushed as usual, that I began to understand Stewart’s plea. Andrew raised his voice in his characteristic half-sarcastic, half-pedagogic tone, “So what do you know about data standards?” And thus, we began a dive into biodiversity informatics.
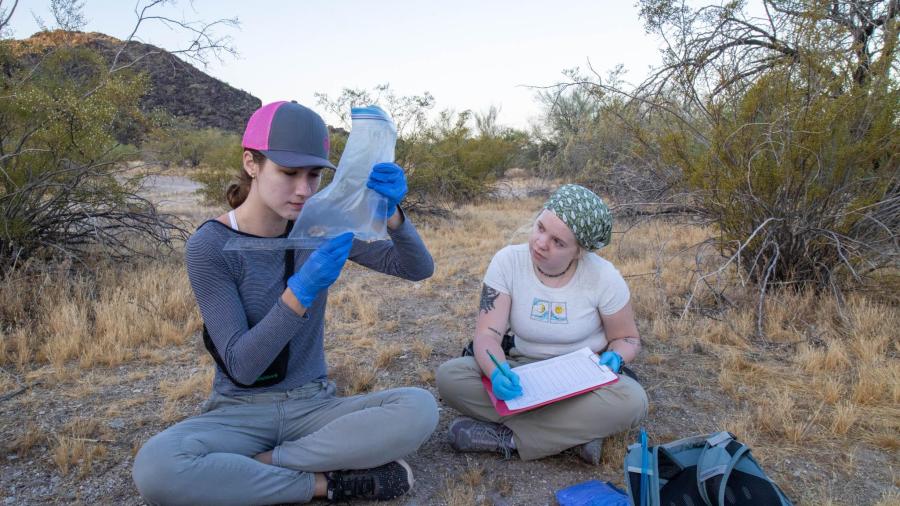
On our trips to the Big Horn Mountains and Pinto Springs, we collected a fair amount of data: the coordinates of a pitfall trap, the name of a saltbush. Dakota even boasted that we set a “gold standard” for small mammal data collection after our Big Horn trip. Throughout all of it, the collection managers periodically assured me, “This is really important. The more detailed the data, the better,” when my mind began to wander to the inevitable How is this useful? That question was never immediately answered but, rubbing my temples to prepare for the next couple hours on the computer, I had a presentiment we were close.
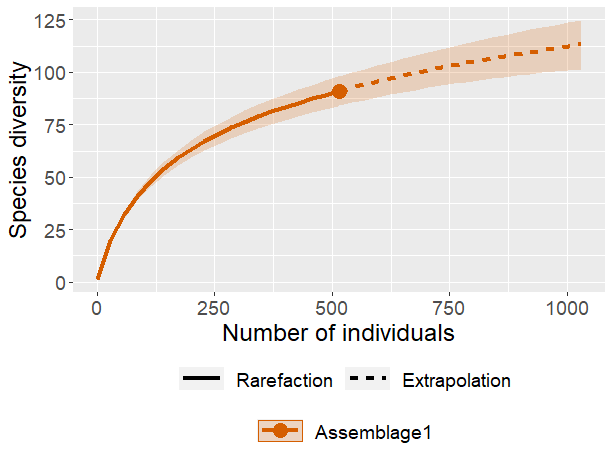
Andrew assumed a more serious tone as he introduced us to basic principles in R, a common programming language in ecology research, leading us through a simple tutorial. We extracted data from GBIF, a compilation of records from myriad biodiversity platforms, filtering it and manipulating it until we soon had beautiful data visualizations. Specifically, we used a pre-built function called ggiNEXT to create species accumulation curves.
And, strangely, I felt the slightest bit competent throughout this tutorial. Though our foray into data science was incredibly brief, it clicked with me in a way and warmed my heart in a way I don’t often experience. Excitement would well up in me when Ava asked how to use the filter function and I could leap up to explain it with my inchoate understanding.
However, more profoundly, I felt some semblance of awe shiver down me when I finally hit Run and saw a scatterplot materialize—data points across a century and a continent arranging themselves into a pattern I could make sense of. Andrew made sure we contemplated this awe; he’d tell me, “You are the first person in the world to see the species accumulation curve of composites on the Sierra Estrella.” Tabitha, who was on the laptop next to mine, gave a long Oooh and smiled at me. What an honor, I suppose, though that incessant question Who needs to know that? still nipped at my heels.
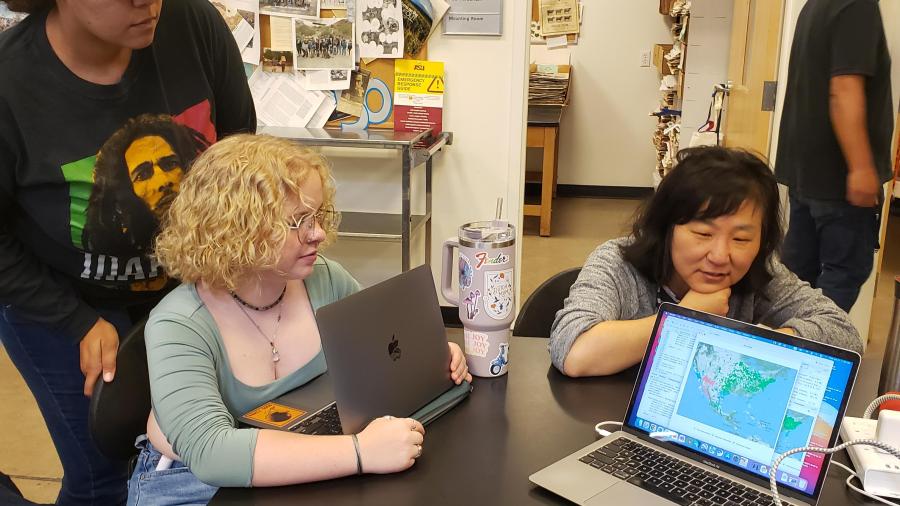
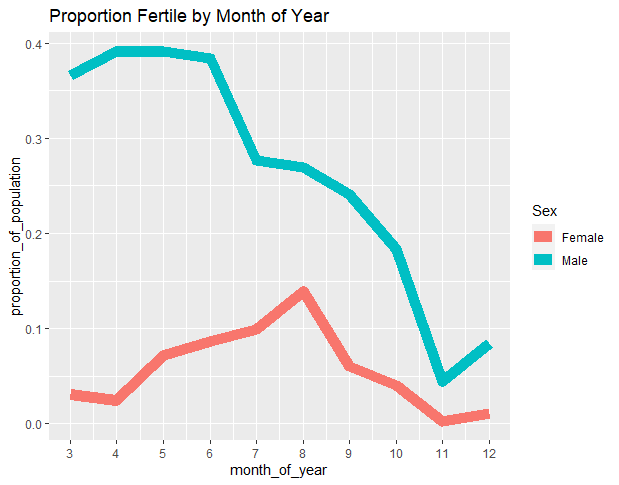
Over the next week, Kelsey instructed us through several other applications of R in biodiversity science before eventually tasking us with generating a research question using any of the data sources we had reviewed. Joscelyn and I decided to investigate seasonal reproductive trends in rodents. Though I got caught up in figuring out how to arrange data and make it look presentable—and in doing so somewhat neglected the core question—when it came time to present our results, despite knowing little about rodents’ mating habits, Joscelyn and I had a semi-coherent story to tell. That was no virtue of our own, however, that was just nature speaking through numbers. Perhaps that was exactly what Quincy Stewart wanted me to realize on that tour.
Though I hold respect for the wisdom of plants above all else, I do not consider myself even an amateur naturalist. Thus, I found it difficult to feel truly in my element on the field trips, as the bounty of things I did not know and did not notice nagged at me. However, during bioinformatics week, although I was not in the presence of nature, I felt as though I was returning at least some of the grace it’s provided for me; I was appreciating its mystery—its charm—in the way I had loved since my first visits to natural history museums: through data.